Our stakeholders have told us that information on revenue stacking can be difficult to find, inconsistent and even contradictory. The purpose of this webpage is to improve the clarity of revenue stacking rules and highlight existing opportunities.
What is revenue stacking?
Revenue stacking is where a single flexible asset participates in multiple markets, to maximise its value to the energy system. Flexibility service providers can receive multiple payments as a result.
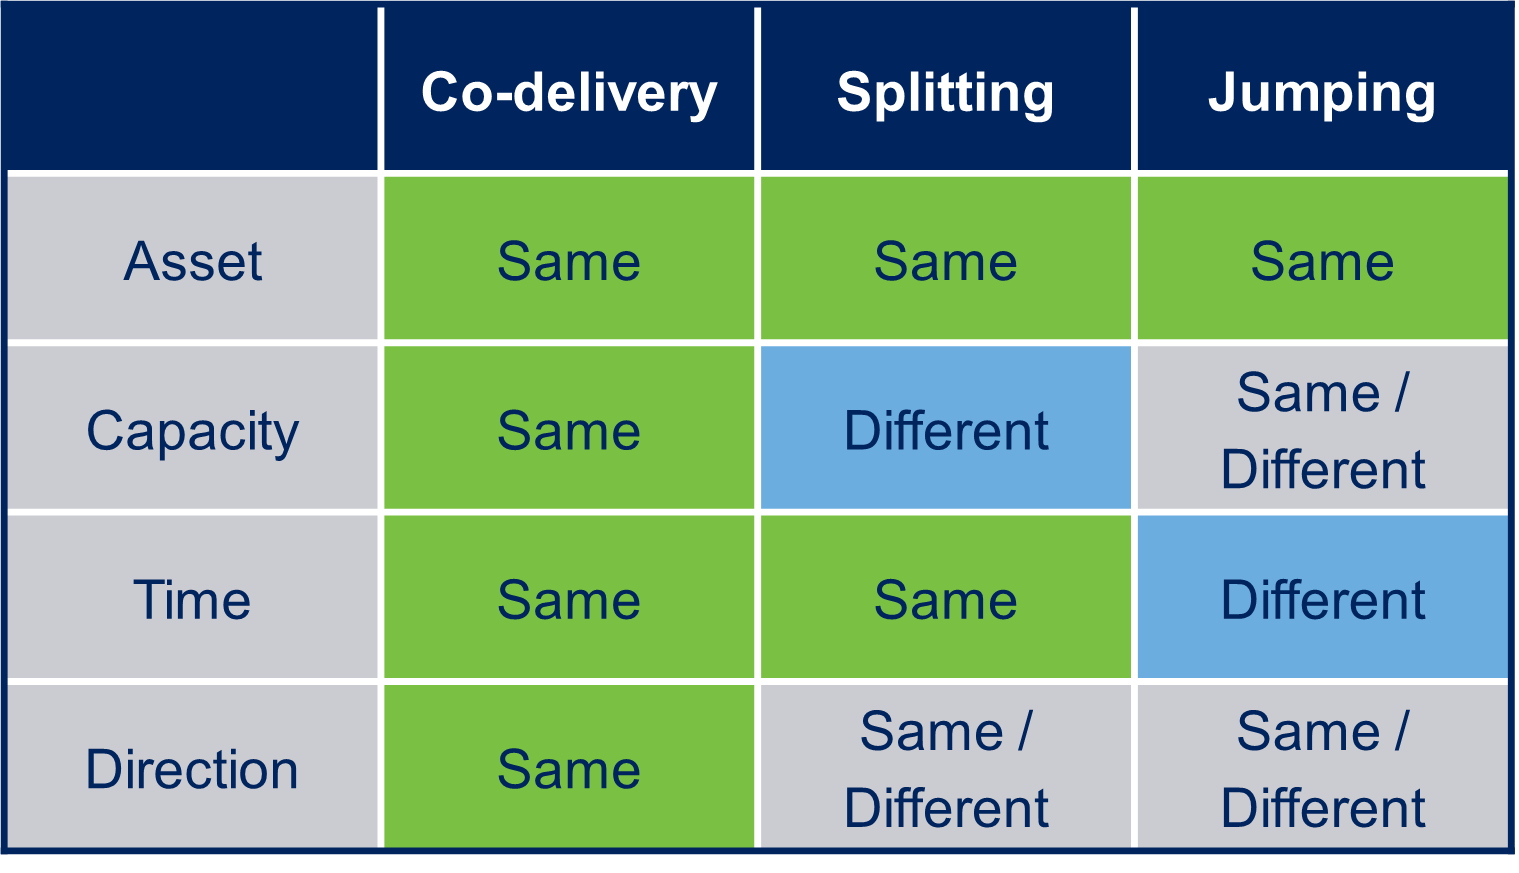
Revenue stacking can be split into three categories:
- Co-delivery: a single asset receives multiple payments for using the same capacity, at the same time, in the same direction.
- Splitting: a single asset receives multiple payments for using different capacity, at the same time.
- Jumping: a single asset receives multiple payments for services in different times (adjacent or non-adjacent).

Examples of Co-delivery, Splitting and Jumping
Co-delivery
A single asset receives multiple payments for using the same capacity, at the same time, in the same direction.
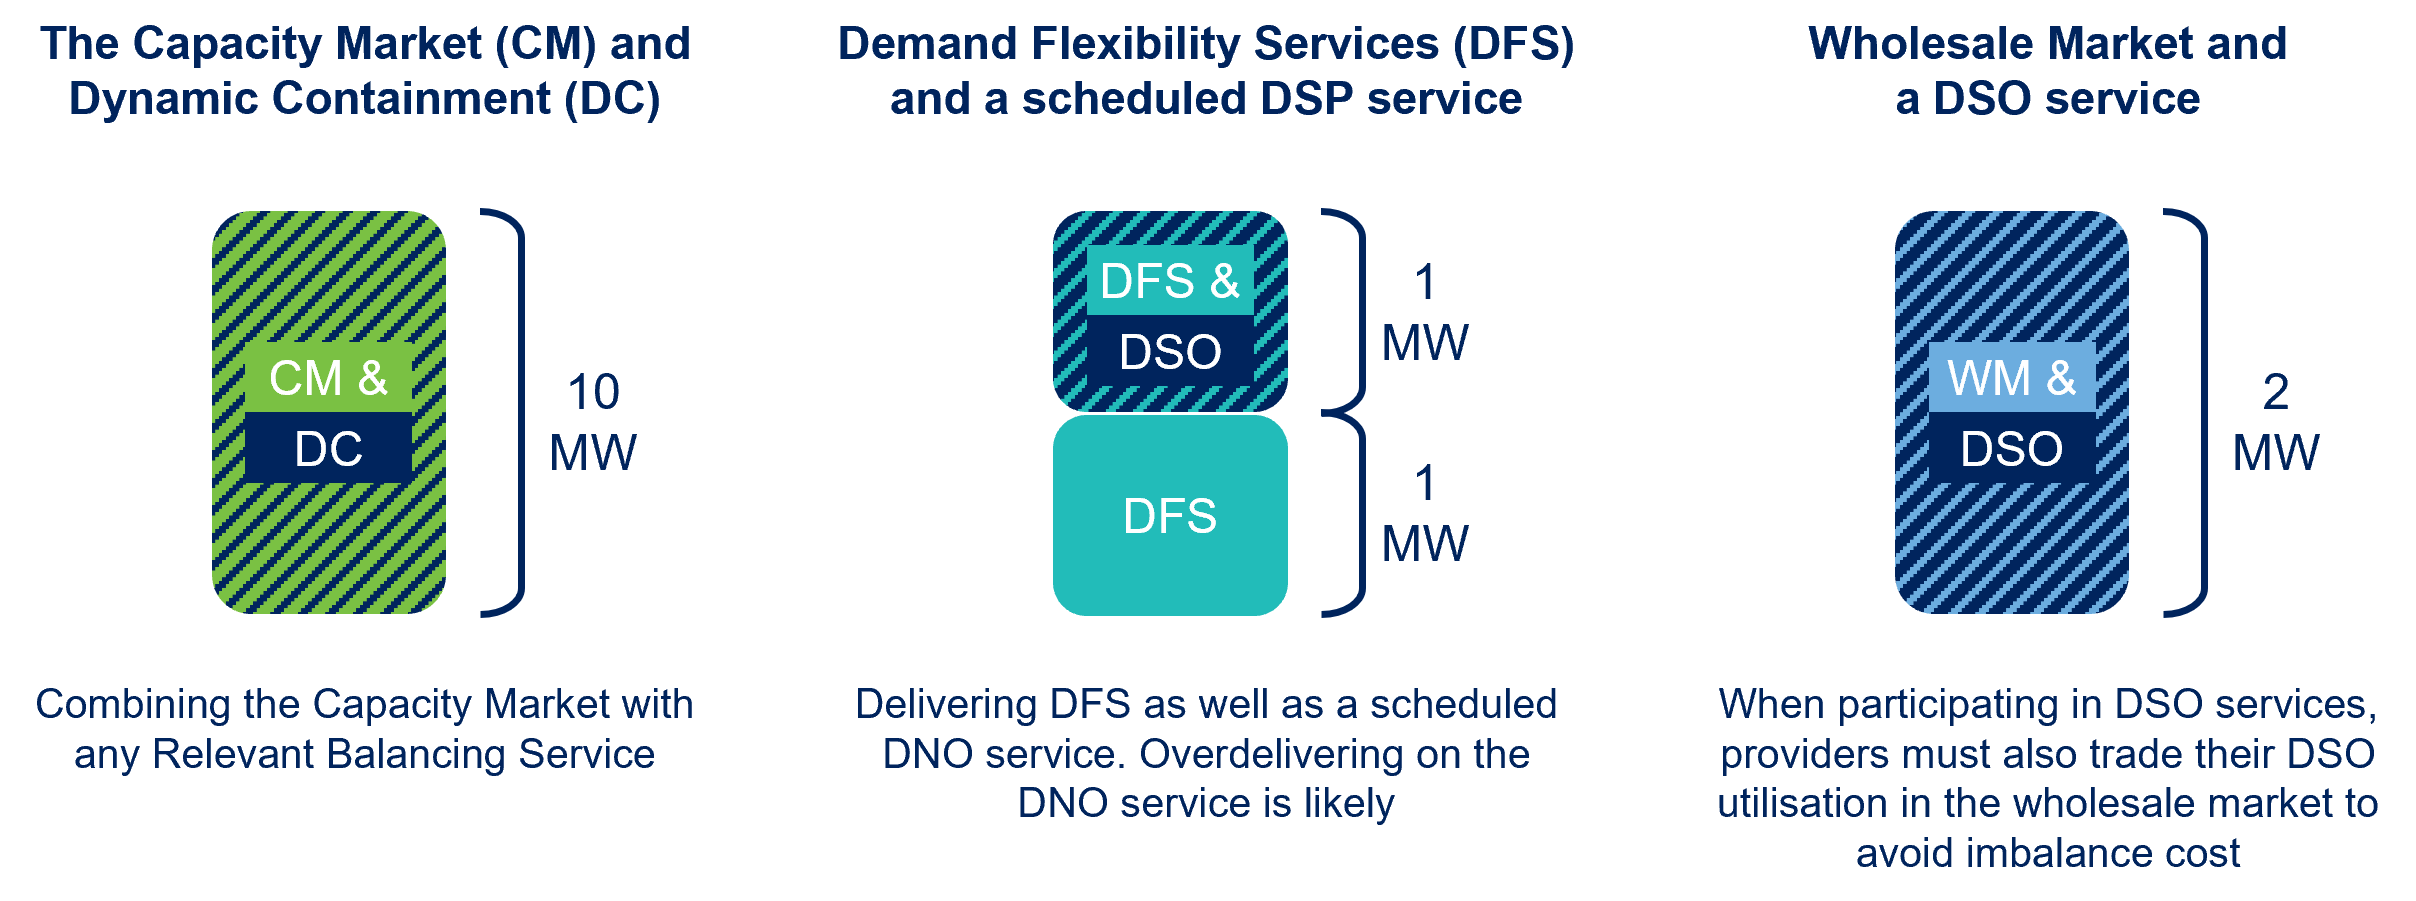
The example on the left shows how a single asset can be paid for providing Capacity Market (CM) and Dynamic Containment (Low). The asset, which can offer 10MW of generation turn up, can be paid twice for that 10MW. The Capacity Market can be co-delivered with ‘relevant balancing services’ as defined here.
The example in the middle illustrates that a single asset (or group of assets) can Co-deliver against the Demand Flexibility Service (DFS) and a scheduled DSO service. The asset, which can deliver demand turn down of 2MW, can deliver and be paid against both the DFS and DSO service.

Splitting
A single asset receives multiple payments for using different capacity, at the same time.
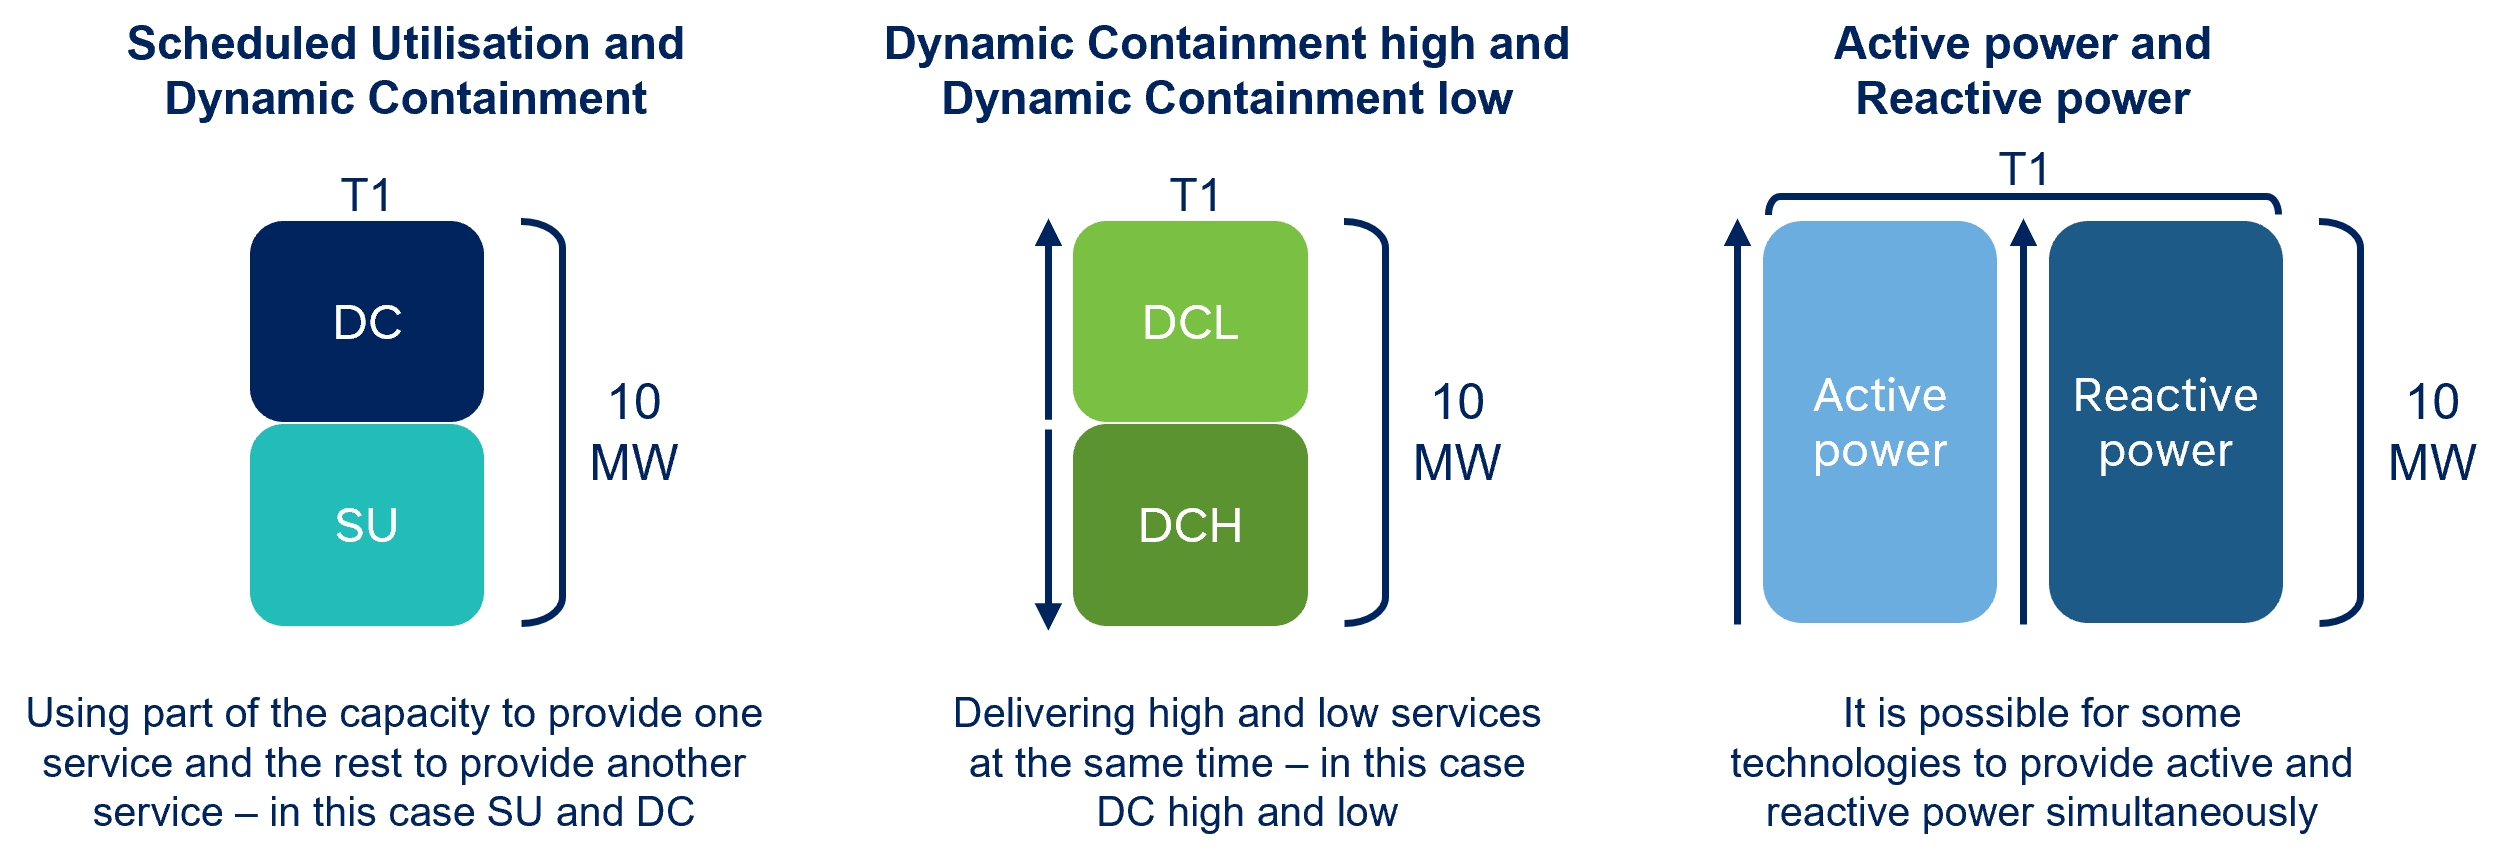
The examples below show different ways of splitting flexible capacity between two services. The first example illustrates where services are in the same direction, and where the baseline of one service may be adjusted for the other. Examples 2 illustrates where services are delivered in opposite directions - either because of adjusted baselines, or because services are not required simultaneously (e.g. Dynamic Containment High and Low). The final example shows additional stacking potential in cases where an asset can provide flexibility in both active (kW) and reactive power (kVA).

T = Time | DC = Dynamic Containment | SU = Scheduled Utilisation | WM = Wholesale Market
Jumping
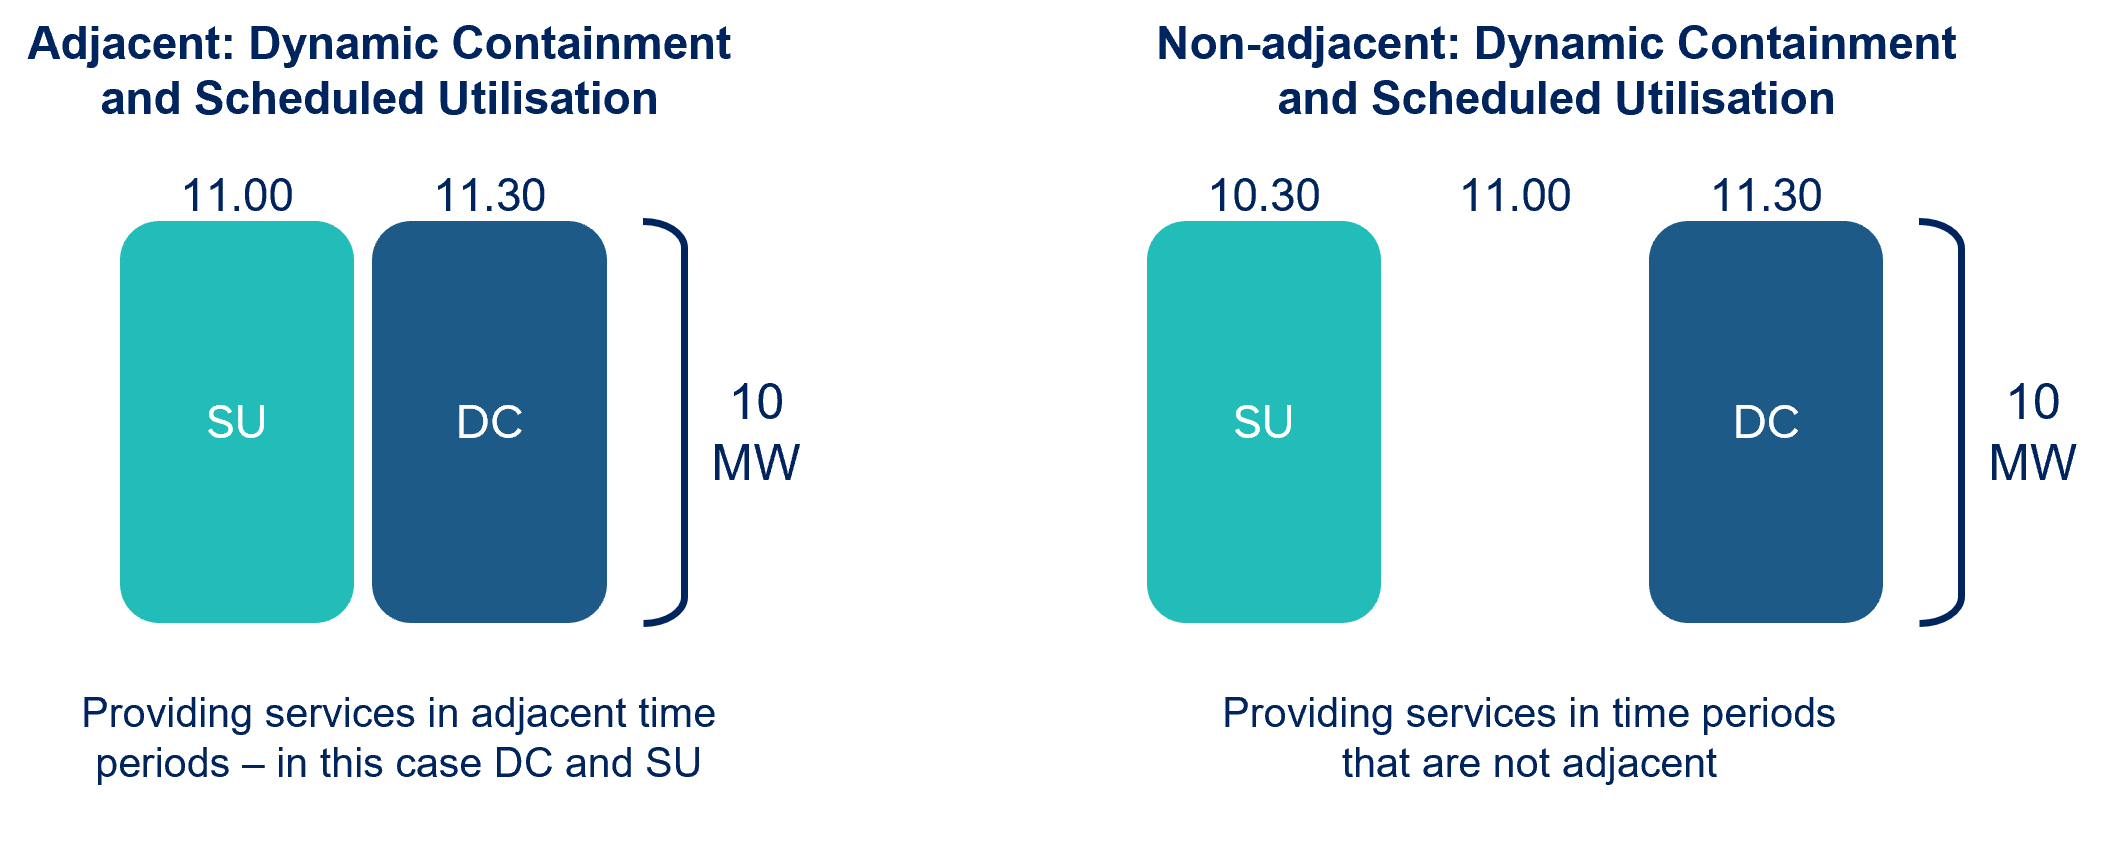
A single asset receives multiple payments for services in different times (adjacent or non-adjacent).
Examples where Jumping is permitted are widespread. That said, providers should consider any technology-related constraints (e.g. maximum duration of response or time between activations). There may also be limitations how quickly assets can be registered or de-registered from a service.

T = Time | DC = Dynamic Containment | SU = Scheduled Utilisation
What revenues can you stack?
The Revenue Stacking Excel Tool was created as an authoritative and intuitive tool for stakeholders.
The tool includes revenue stacking information from the NESO’s Markets Roadmap and the ENA’s Revenue Stacking Assessment for DSO Services. The tool has been validated by the NESO and all DSOs.
We welcome feedback on the tool, particularly relating to its usefulness, usability and potential. If you have ideas for how it can be improved, please email: opennetworks@energynetworks.org.


